Boundary design mlb with single fluidic lane adjacent to sidewalls
Adjusting design parameters
import matplotlib.pyplot as plt
import numpy as np

from mnflow.mfda.cad.dld.theme.block import DLD
dld = DLD(
    d_c=10.0,
    Np=40,
    # boundary
    boundary_treatment='mlb',
    dep_top_gap_deviation_nondim=[-0.9],
    acc_top_gap_deviation_nondim=[0.9],
    #
    num_unit=2,
    #
    rotation_angle_deg_before_array=90,
    # image
    opt_save_image=True,
    img_dpu=2,
)
----------------------------------------
core.DLD___Np:40_Nw:8_gap_w:41.962_pitch_w:83.925_gap_a:41.962_pitch_a:83.925_height:167.850_boundary_treatment:mlb
block.DLD___num_unit:2_opt_mirror:False_array_counts:[1, 1]_opt_mirror_before_array:[False, False]
----------------------------------------
{'Np': 40,
 'Nw': 8,
 'area': 6011632.792110001,
 'bb': [(-6672.028, -211.907), (41.962, 683.482)],
 'count of 1D arrays of core.DLD': 1,
 'd_c': 9.999999999999998,
 'lx': 6713.990000000001,
 'ly': 895.389,
 'performance': {'Flow rate @ 1 bar/area (micro-liter/min/mm-sq)': 1756.7039299780977,
                 'die area (mm-sq)': 6.01163279211,
                 'gap over crit. dia.': 4.1962442597075205,
                 'volumetric flow rate at 1 bar (micro-liter/min)': 10560.658951484842},
 'resistance (Pa.sec/m^3)': 568146365445.9169,
 'volumetric flow rate at 1 bar (m^3/sec)': 1.7601098252474735e-07,
 'volumetric flow rate at 1 bar (milli-liter/hr)': 633.6395370890905}
/usr/bin/xdg-open: 882: www-browser: not found
/usr/bin/xdg-open: 882: links2: not found
/usr/bin/xdg-open: 882: elinks: not found
Output layout:

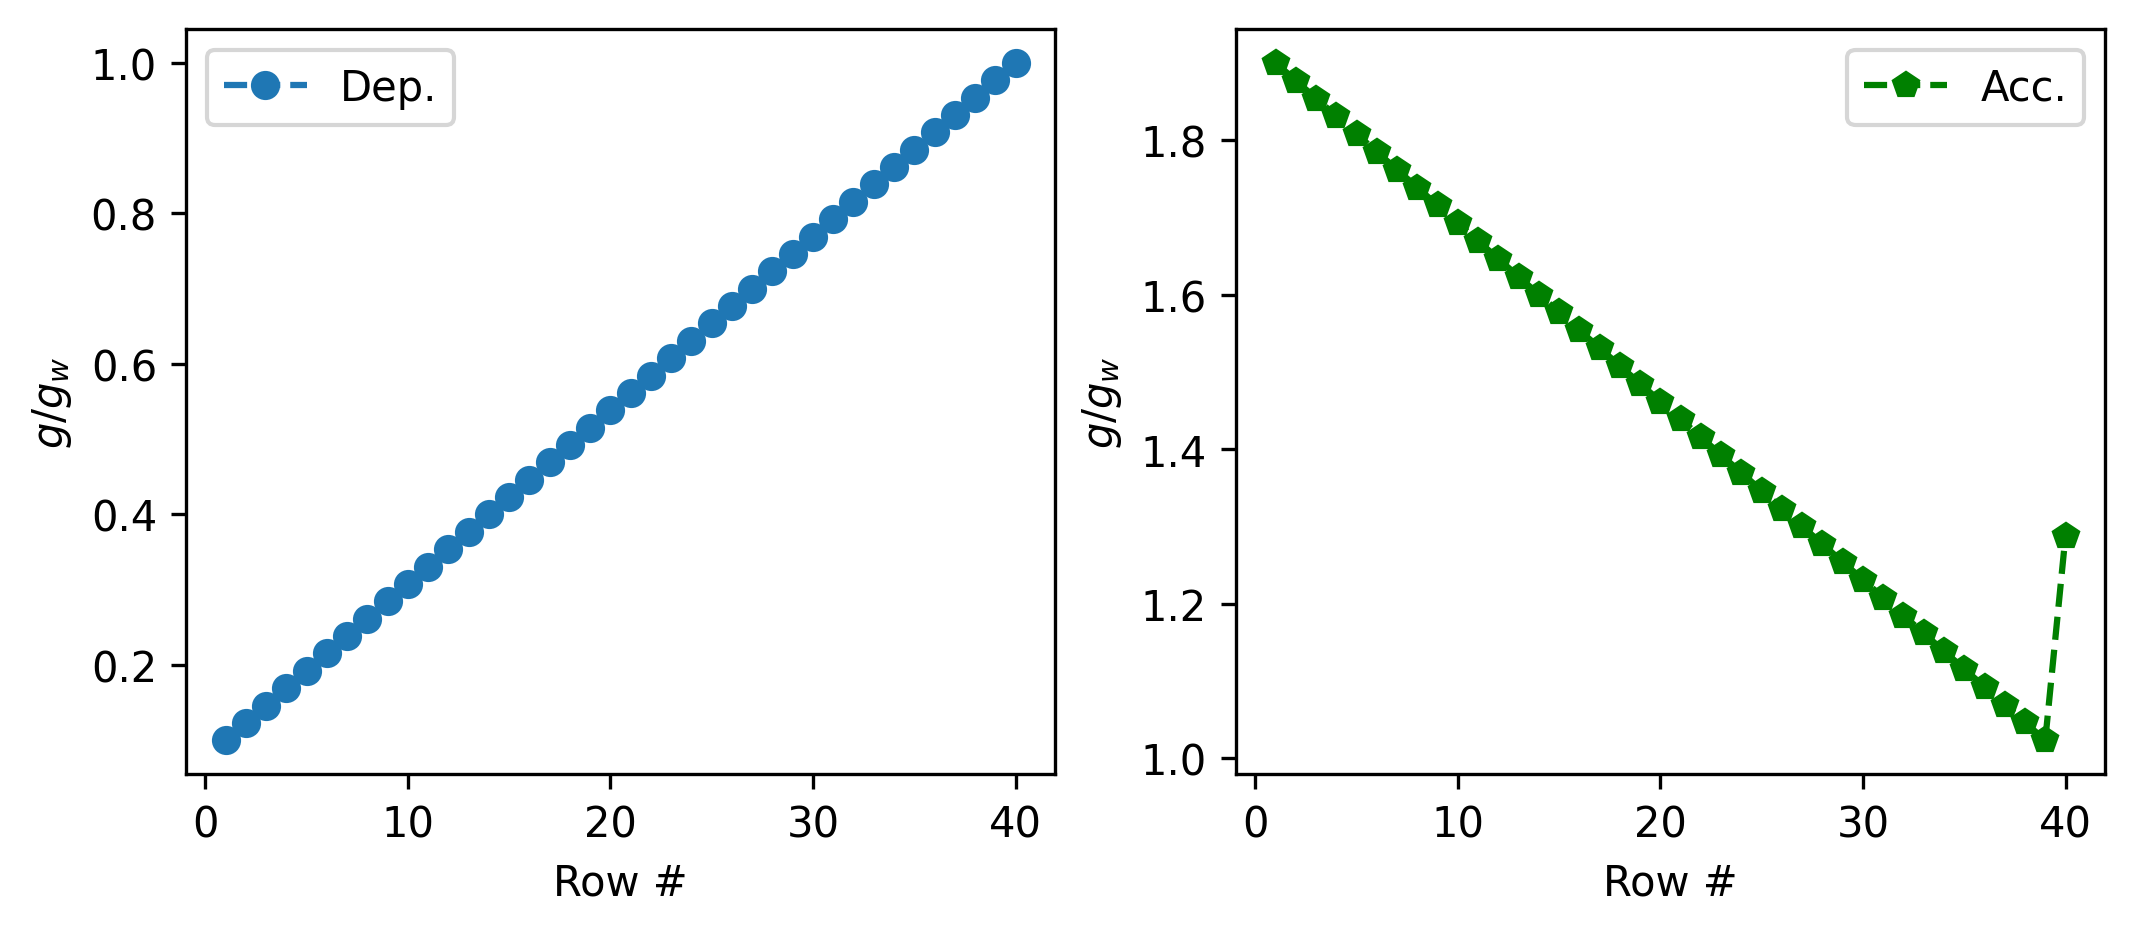
Visualization of gap profiles
Here is how dimensionless gap profiles look like for depletion and accumulation sidewalls:
Np=dld.Np
gap_a=dld.gap_a
gap_w=dld.gap_w
phi=dld.phi
boundary_gaps=dld.get_boundary_gaps()

dep_gap=np.array(boundary_gaps['dep'][:,:-1]).flatten()
acc_gap=np.array(boundary_gaps['acc']).flatten()
if boundary_gaps['acc_usm_gap_a_widening'] is None:
    boundary_gaps['acc_usm_gap_a_widening']=0
acc_Nth_lat_gap=boundary_gaps['acc_usm_gap_a_widening']+gap_a

fig, ax=plt.subplots(1,2,figsize=(7,3),dpi=300, layout="constrained")
ax[0].plot(np.arange(1,Np+1), dep_gap[::-1]/gap_w, '--o', label="Dep.")
ax[1].plot(np.arange(1,Np+1), acc_gap[::-1]/gap_w, '--gp', label="Acc.")
ax[0].set_xlabel('Row #')
ax[1].set_xlabel('Row #')
ax[0].set_ylabel(r'$g/g_w$')
ax[1].set_ylabel(r'$g/g_w$')
ax[0].legend()
ax[1].legend()
plt.show()
/usr/bin/xdg-open: 882: lynx: not found
/usr/bin/xdg-open: 882: w3m: not found
xdg-open: no method available for opening '/tmp/tmpqkabnunn.PNG'
And, values of important parameters and variables:
print("Np: ", Np)
print("gap_w: ", gap_w)
print("phi: ", phi)
print('gap dep: ', dep_gap)
print('gap acc: ', acc_gap)
print('gap acc widening -- Nth row, lat: ', boundary_gaps['acc_usm_gap_a_widening'])
print('gap acc -- Nth row, lat: ', acc_Nth_lat_gap)
Np:  40
gap_w:  41.962442597075196
phi:  1
gap dep:  [41.9624426  40.99400334 40.02556408 39.05712482 38.08868556 37.12024631
 36.15180705 35.18336779 34.21492853 33.24648927 32.27805001 31.30961076
 30.3411715  29.37273224 28.40429298 27.43585372 26.46741447 25.49897521
 24.53053595 23.56209669 22.59365743 21.62521817 20.65677892 19.68833966
 18.7199004  17.75146114 16.78302188 15.81458263 14.84614337 13.87770411
 12.90926485 11.94082559 10.97238633 10.00394708  9.03550782  8.06706856
  7.0986293   6.13019004  5.16175078  4.19331153]
gap acc:  [54.04571856 42.93088186 43.89932111 44.86776037 45.83619963 46.80463889
 47.77307815 48.7415174  49.70995666 50.67839592 51.64683518 52.61527444
 53.5837137  54.55215295 55.52059221 56.48903147 57.45747073 58.42590999
 59.39434924 60.3627885  61.33122776 62.29966702 63.26810628 64.23654554
 65.20498479 66.17342405 67.14186331 68.11030257 69.07874183 70.04718109
 71.01562034 71.9840596  72.95249886 73.92093812 74.88937738 75.85781663
 76.82625589 77.79469515 78.76313441 79.73157367]
gap acc widening -- Nth row, lat:  12.083275959679746
gap acc -- Nth row, lat:  54.04571855675494